“By listening to a work in progress too often, you can set a pattern in your brain, which makes it hard to change.”
Most drivers have likely experienced the strange, but all-too-common phenomenon of a “phantom traffic jam.” After traveling down the road at a normal pace, suddenly traffic comes to a screeching halt without any apparent explanation (a wreck, a broken-down vehicle, etc.) for why the standstill occurred. Phantom traffic jams are caused when a driver unexpectedly brakes during a time of high traffic density, bringing everyone behind to an abrupt stop. Sometimes these slowdowns seem to happen in regular, wavelike intervals, which MIT researchers have called a “jamiton” (source). (The word was derived from “soliton,” a mathematical term for a self-reinforcing wave that maintains shape while also moving.) Jamitons can continue for miles and closely mirror travelling detonation waves, like those seen or felt in the aftermath of an explosion. They originate because of the “adjustment time” needed for people to react to new traffic conditions and are usually counter acted by the propensity of drivers to become more cautious afterwards.
The Federal Reserve Has Created An “Economic Jamiton”
We do not envy the job of the Federal Reserve Board, nor do we consider ourselves better suited to serve in their position. Rather than “Monday-morning quarterbacking” various Fed policy decisions, we try to anticipate the effects that their present-day actions might have on the value of businesses we own. The Fed’s control of the “discount rate” is extremely important for us to observe and assess, since it has a near-gravitational effect on the price of all risk assets. In 2022, stocks and bonds began adjusting to a new (higher) discount rate. Although the Fed does not explicitly target a particular number, they rely on the discount rate as an important tool to achieve their stated mandate by Congress for enacting monetary policy:
“…so as to promote effectively the goals of maximum employment, stable prices, and moderate long-term interest rates.”
Whereas the phrase “price stability” has essentially been defined as inflation averaging around 2%, “maximum employment” is a little more esoteric and refers to the highest level of employment that doesn’t lead to high inflation. When the Fed toggles the Fed Funds rate to address their mandate, it tends to have an inverse effect on asset prices (i.e., higher rates correspond with lower multiples).
CHART 1: US CPI Y/Y and Unemployment Rate
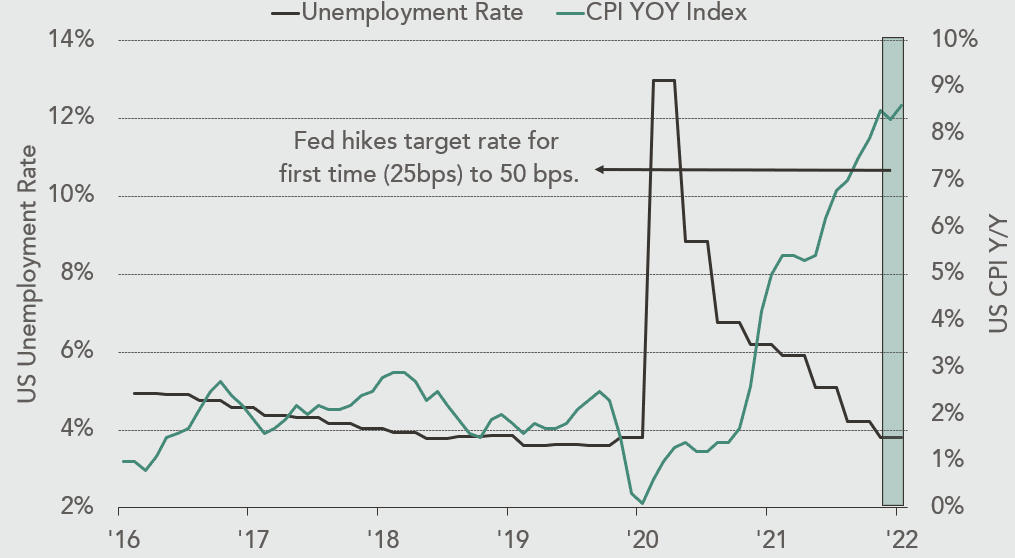
Source: Bloomberg. Data through May 30th, 2022.
Three important data points from the last couple of years signaled that the Fed should raise interest rates: 1) Commodity prices more than doubling off their lows in 2020; 2) US jobless claims and unemployment returning to pre-COVID levels; and 3) the Consumer Price Index (CPI) climbing to levels not seen since the early 1980s (CHART 1). Clearly the post-COVID economy ran hotter for longer than the Fed initially anticipated, causing them to respond with the fastest pace of rate hikes since 1994. The Fed essentially tapped the breaks in heavy traffic, and markets are now experiencing the first wave of an economic jamiton:
- Existing home sales have declined for four straight months, while pending home sales started falling m/m last October and have only posted one month of growth since then.
- Commercial real estate property sales decreased 16% y/y in April, the first decline in 13 months according to MSCI Real Assets.
- The Bloomberg Commodity Index peaked in March of 2022 and has already declined by more than 14%.
- Copper is down approximately 34% from highs.
- Wheat is down approximately 35% from highs.
- Jobless claims troughed in March of 2022 with only 1.1 claim per 1,000 people in the work force. Claims have since risen 37% as layoffs are being felt across the tech sector. – United States Department of Labor
- US ISM Manufacturing PMI peaked in March of 2021 and is now back to its 20-year average.
The downward re-rating of multiples reflects the slowdown in economic momentum. While “pundits” will warn of numerous obstacles down the road, we might simply be feeling the reversion of COVID-stimulated excesses that weren’t sustainable in the first place.
The Fed Funds rate is expected to more than double to 3.4% by year end, which could dampen risk appetites in the short term. However, we believe the current jamiton may start to dissipate once the Fed brings inflation under control and earnings expectations are sufficiently recalibrated. This could mean that an economic recession is in store, but the market is highly anticipatory (something we often write about), and asset prices will begin staging a recovery long before there is clear evidence that inflation has been defeated and earnings growth can resume.
Stay up to date
Subscribe to receive our quarterly investor letters and market updates.

Debt and Demographics: The Inflation Killer?
While fears of rampant 1970s-style inflation have dominated the headlines in 2022, we find it helpful to analyze longer-term trends to decipher whether inflation will prove to be a secular or cyclical problem this time around. Hoisington Investment Management has written incessantly about the prolonged impact of high US government debt on domestic interest rates and economic growth. They are predicting that the elevated US national debt will prevent inflation from becoming widely entrenched:
“The concept of the debt trap is consistent with scholarly research, from the 19th century to present, which indicates that high debt levels undermine economic growth.”
“As proof of this connection, each additional dollar of debt in 1980 generated a rise in GDP of 60 cents, up from 54 cents in 1940. The 1980s was the last decade for the productivity of debt to rise. Since then, this ratio has dropped sharply, from 42 cents in 1989 to 27 cents.”
CHART 2: Annual Percent Change in U.S. Population and U.S. Federal Debt to GDP
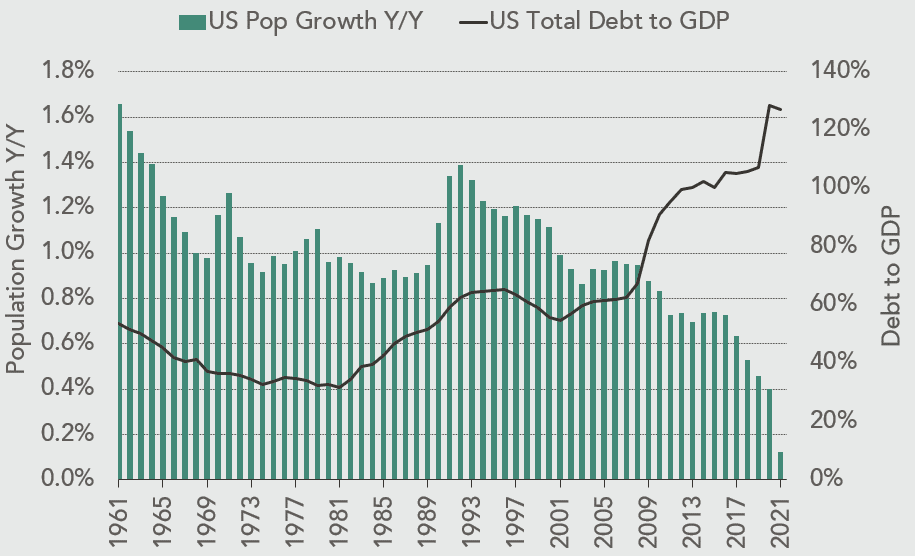
Source: Bloomberg.
Today, the total US federal debt as a percentage of GDP stands at 125%, below the 136% peak reached in April of 2020, but well above the 63% average seen over the last 50 years. One can see in CHART 2 that the rising level of debt is directly coinciding with a serious decline in US population growth.
As it relates to demographics, just consider these statistics and the ramifications for growth and government spending in the years to come:
- The US population grew only 0.1% in 2021 (YE July), representing the lowest rate of increase since 1900, according to the US Census Bureau.
- In 1980, the number of working-age adults per older adult (>65yrs) stood at 5.4 and working-age adults per child (<18yrs) stood at 2.2. In 2020, working-age adults per older adult stood at 3.6 with 2.7 working-age adults per child. By 2030, these ratios are estimated to reach parity, at roughly 2.8 each. This will be the first time in US history when the support ratio for older adults is equal to the same ratio for children.
CHART 3: US GDP Y/Y
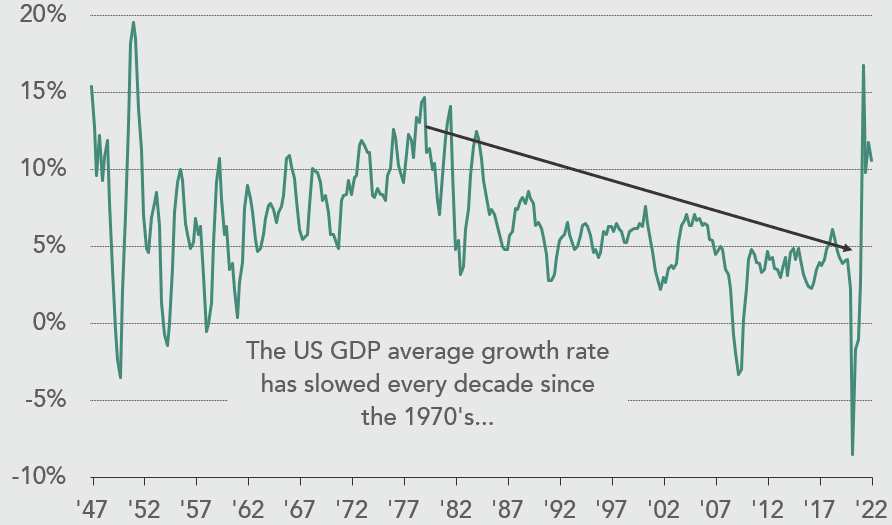
Source: Bloomberg. Data through March 31, 2022.
Hoisington also highlights the GDP drag that comes from population deterioration:
“Poor demographics retard economic growth by lowering household, business and state and local investment. This keeps intact the observable trend in numerous countries — extreme over-indebtedness reduces economic growth which, in turn, worsens demographics, which reinforces the weakness emanating from the debt overhang.”
Short-term inflation numbers and the Fed’s aggressive response are driving market participants to speculate that “this time is different.” Looking at the US GDP data from CHART 3, one can see that growth has in fact been on a downward trajectory since the 1970s (slowing every decade since then). The long-term growth overhang from debt and demographics, combined with the Fed’s currently hawkish tilt, could impede prolonged inflation from taking hold. Perhaps the economy will revert to its slow- to moderate-growth trendline, interest rates won’t rise as much as feared, and the economic jamiton will subside more quickly than some expect.
Two Investment Pendulums: Sentiment and Valuation
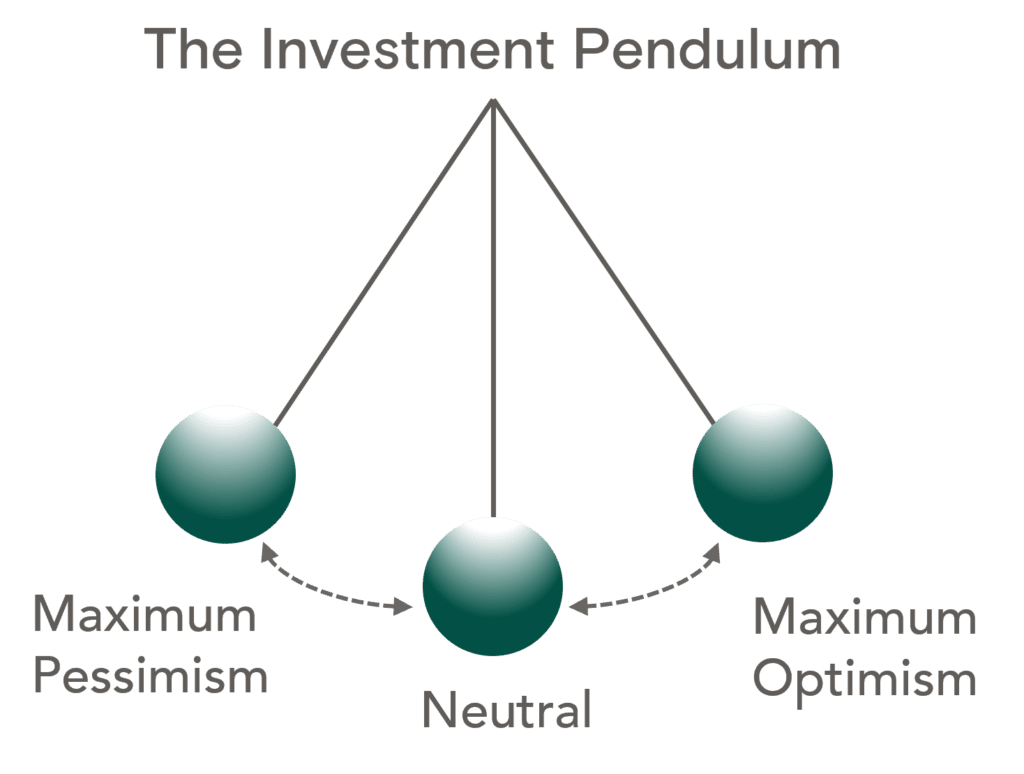
Howard Marks coined the phrase, “the pendulum of investor psychology” in his book Mastering the Market Cycle. His description of markets from over 30 years ago still applies today:
“The mood swings of the securities markets resemble the movement of a pendulum. Although the midpoint of its arc best describes the location of the pendulum ‘on average,’ it actually spends very little of its time there. Instead, it is almost always swinging toward or away from the extremes of its arc. But whenever the pendulum is near either extreme, it is inevitable that it will move back toward the midpoint sooner or later.”
Our belief is that there are two investment pendulums always swinging in the marketplace: 1) Investor Sentiment and 2) Business Valuations. These pendulums do not always oscillate in sync or even in the same direction, but they share similar fulcrum points. At certain times, negative sentiment coincides with low valuations and the market provides an incredible buying opportunity. Conversely, euphoric sentiment can line up with high valuations to create a great selling opportunity.
In our Q3 2021 letter we wrote, “Our biggest concern is that current expectations for growth and fundamental improvement are too high.” We went on to explain that “While we were aggressively playing offense for most of 2020, we’ve shifted to a more defensive stance…”
Our pivot towards defense was driven by a belief that both pendulums (sentiment and valuation) were nearing points of maximum optimism last year, thus signaling an auspicious selling opportunity. This was not simply a “gut feeling” we had at the time. Rather, it was based on numerous data points that were readily observable. Below are some market statistics we noted from 2021 which highlight just how rosy the environment was back then.
Sentiment – Maximum Optimism
- US equity ETFs saw inflows of $165 billion in 2020. Inflows of $461 billion in 2021 trounced that number and set a record. – Bloomberg
- The VIX Index (volatility), fell to the lowest level in three years.
- Equities as a percentage of household assets hit a record 37% in 2021, surpassing the 33% milestone seen in the year 2000.
- There were 600 SPACs in 2021 (a record), and at one point SPACs were pulling in more than 90% of the money raised through IPOs.
- Bitcoin—the poster child of speculative bets—reached all-time highs of $67,000 per coin.
- Terms like “neo-value investing” were created to defend speculation in companies with no earnings or cash flow.
Valuation – Maximum Optimism
- The S&P 500 traded at a forward multiple of 22x in 2021, ranking in the 99th percentile since 1976.
- During 2021, a tech basket of five companies (Tickers: SNOW, U, HOOD, TEAM, TTD) with no cash flow had a combined market cap of $311 billion with only $8.5 billion in revenue, implying a 36x Price/Sales multiple.
- Within the tech space, Satya Nadella (CEO of Microsoft) sold $285 million worth of Microsoft stock on 11/22/2021. The share price peaked on that same day at $349.67.
- US equity market cap as a percentage of GDP hit a record 200% in 2021.
- Investors were willing to lend their money to the US government for 10 years in exchange for a negative 4% real return.
Our preferred “hedge” during these euphoric periods is cash, and the portfolio’s cash level is higher than almost any other time in firm history. As both pendulums started swinging towards a more neutral position earlier this year, we chose to remain patient, realizing that inertia makes it difficult for swings to reverse course instantaneously. However, we now believe that the sentiment and valuation pendulums have swung past neutral to negative, and our view is supported by the following data:
Sentiment – Maximum Pessimism
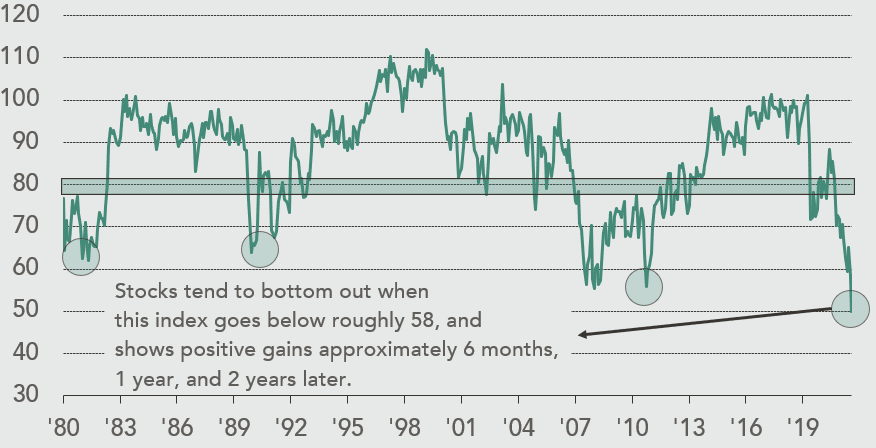
- The University of Michigan Consumer Sentiment Index logged its most bearish reading since 1978 (CHART 4).
- There have been eight sentiment troughs since 1970. The average 12-month return for the S&P 500 after a sentiment trough is +25%.
- The AAII Bulls to Bears Ratio sank to its lowest level going all the way back to 1987.
- Over a seven-day trading stretch in June, five days saw more than 90% of stocks decline, which is the first time that has happened in nearly one hundred years.
- Mortgage rates have risen rapidly to ~6%, the highest level since November 2008. We’ve witnessed the fastest rise in mortgage rates since 1987.
Valuation – Maximum Pessimism
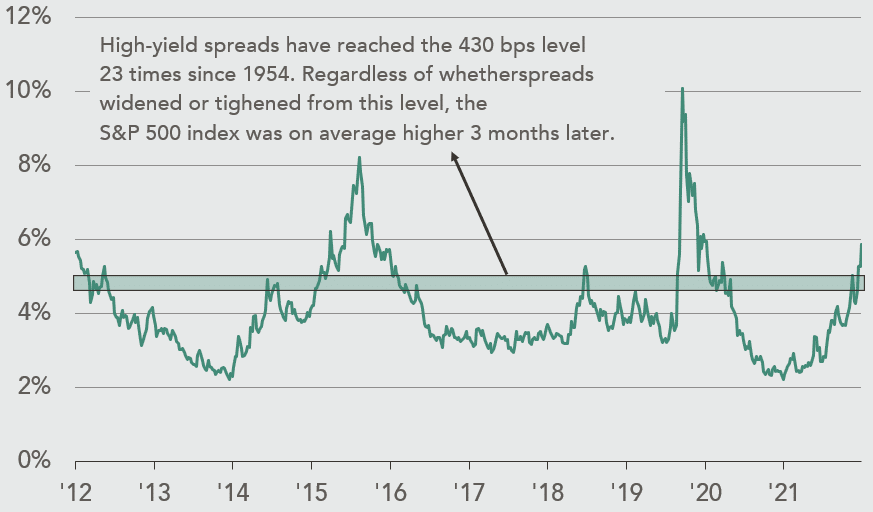
- US High-Yield Junk spreads over 10-Year Treasuries have almost tripled from a low of ~200bps to ~600bps (CHART 5).
- The ARK Innovation ETF, a tech-heavy instrument that owns cash-burning companies like those of the internet boom, has fallen by 78% from its 2021 peak. (This closely mirrors the 78% peak-to-trough decline in the Nasdaq Index during the dotcom bust of 2000.)
- Klarna, a high-flying, buy-now-pay-later startup, is raising funds at a valuation of only $7 billion compared to the $46 billion valuation it received last year.
CHART 4: Univ. of Michigan Sentiment Index
Source: Bloomberg & Sentiment Trader. Past performance is no guarantee of future results. Data through Jun. 30th, 2022.
CHART 5: U.S. High Yield Spread vs. 10-Year Treasury
Source: Bloomberg and Verdad Advisors. Data through Jun. 30th, 2022.
Portfolio Commentary
Based on the year-to-date multiple compression of nearly all our holdings, the market is evidently anticipating a deterioration in fundamentals caused by the ongoing “economic jamiton.” However, we know that investor time horizons tend to shorten during periods like this, and market prices can become irrational. Successful investing in public equities requires “staying the course” and acting opportunistically when the pendulums of sentiment and valuation reach extremes.
We are optimistic about compounding returns from here, particularly because we believe these two pendulums have swung past neutral and are nearing maximum pessimism. We are confident they will swing back towards optimism over time, rewarding opportunistic investors with a long-term view. We have been focused on researching attractive, high-quality businesses, and you should expect to see us deploy cash opportunistically in the near future.
Update on Nixon Capital
We are very excited to announce that Alex Gouws will be joining us in August as an Investment Analyst. Alex worked for us as an intern and recently graduated from Columbia University with a BA in Financial Economics and Philosophy. Having been captain of the Columbia rugby team and an avid chess player, Alex understands the teamwork and analytical rigor needed to win in the investment business. We are delighted to have Alex on our team!
We appreciate your patience during this challenging time and look forward to visiting with you in person later this year.
The Nixon Capital Team
Information contained herein has been obtained from sources believed reliable but is not necessarily complete. Accuracy is not guaranteed. Any views expressed are subject to change at any time, and Nixon Capital disclaims any responsibility to update such views. References to specific securities are not intended and should not be relied upon as the basis for anyone to buy, sell or hold any security. Portfolio holdings and sector allocations may not be representative of the portfolio manager’s current or future investment and are subject to change at any time. This information is not to be reproduced or redistributed to any other person without the prior consent of Nixon Capital LLC. This document has been updated to comply with Rule 206(4)-1(a)(5). Investors may have been provided additional information.