“If you don’t like change, then you will like irrelevance even less.”
In stark contrast to the preceding three years of above-average positive returns, 2022 was one of the worst years for both stock and bond nominal returns in the last century. While many investors over the past decade managed to mitigate equity volatility via exposure to fixed income securities, bond performance was so abysmal in 2022 that it essentially wiped out ten years’ worth of nominal returns for the asset class (TABLE 1). Even in light of the recent equity drawdown, stocks have generated superior long-term returns to bonds, providing a much better hedge against inflation (TABLE 2). Over the past year, however, rising interest rates created a challenging backdrop for equity investors as company valuations were unanimously reset. Roughly 75% of S&P 500-listed companies generated a negative return in 2022, making it a difficult environment for stock selection.
TABLE 1: Bond Index Returns
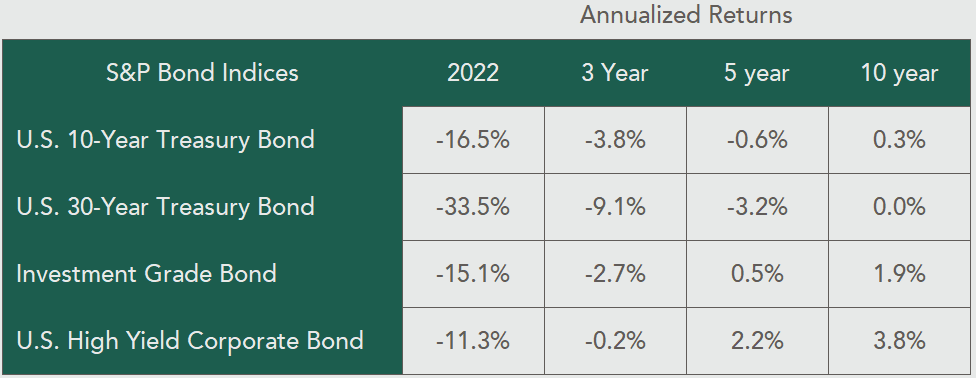
Source: S&P Global. All returns are total index returns as of Dec. 30th, 2022. Past performance does not guarantee future results.
Nixon Capital employees and the Nixon Family together represent our firm’s largest investor, and we believe this establishes exceptional alignment among clients. Although we aren’t pleased with our 2022 results, we acknowledge that our return profile won’t follow a straight line upward. This is precisely why we closed the firm to new capital in 2021, signaling our belief that the investment pendulums of sentiment and valuation had swung beyond maximum optimism and favored being defensive. Our goal, simply put, is to act as opportunistic buyers and sellers of public companies by capitalizing on both sentiment and price volatility.
TABLE 2: Equity Index Returns
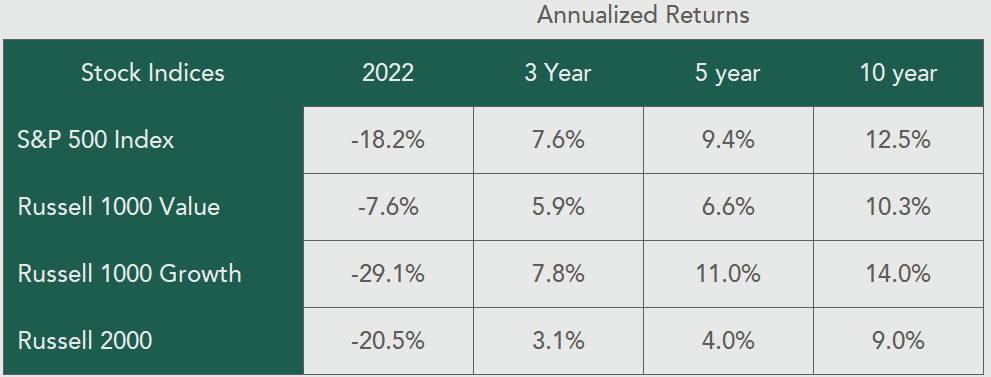
Source: Bloomberg. All returns are the total index returns as of Dec. 30th, 2022. Past performance does not guarantee future results.
Seth Klarman, in his renowned 1991 investment book, Margin of Safety, highlighted the importance of investor/client alignment using an analogy known as the “tremble factor”:
“In the building practices of ancient Rome, when scaffolding was removed from a completed Roman arch, the Roman engineer stood beneath. If the arch came crashing down, he was the first to know. Thus his concern for the quality of the arch was intensely personal, and it is not surprising that so many Roman arches have survived.”
We stand confidently beneath our arch (portfolio) and remain excited about the future prospects of the companies that we own. While our energy investments and large cash position gave us a few A’s on our 2022 report card, they weren’t sufficient enough to raise our overall GPA for the year. As we wrote in a 2015 letter to clients—recapping another period where we scored below average — the simple command given to us on day one was, “Go make us money.” That’s what we intend to do from here.
We cannot predict what will happen to financial markets over the next 12 months, but we do know our process has proven successful throughout numerous market environments. “Time horizon arbitrage,” or the ability to invest in and hold securities through uncertain periods, is one significant advantage we have. We remain focused on the long term and believe that the current setup for delivering attractive absolute returns looks promising.
Stay up to date
Subscribe to receive our quarterly investor letters and market updates.

Post-Mortem for 2022
Our recognition that we were unsuccessful last year in generating competitive absolute returns warrants further reflection on what we did wrong. Three key errors accounted for the majority of losses in 2022:
- COVID-Beneficiaries: Overstaying Our Welcome — We fully exited some of our COVID-related investments at the beginning of 2022 (PHM, NVST, BERY, WHR). These companies traded for above-average valuations after pulling forward years of sales growth during COVID, and they were operating in an almost utopian environment (taking price before cost inflation became an issue). Our mistake was not selling other holdings that similarly benefited from this environment (SONY, RH, YETI, DIS, and GRMN), as we considered them “best-in-class” companies. In reality, the market prices of these businesses had far outrun intrinsic value, and we were punished for believing that business quality would protect against valuation compression. In total, this lapse in judgement accounted for over half of our net losses for the year (~16% realized).1
- Buying Fallen Angels of Growth — 2022 fully erased the COVID-era returns for a large number of high-growth technology companies. After researching and monitoring many of these businesses over the years, we began investing capital in a handful of ones which fell significantly out of favor with growth-oriented investment managers. Most of these businesses (PUBM, UBER, SPOT, and FTCH) share a few similar characteristics: 1) They operate as scalable platforms with superior competitive positions; 2) They have shifted their focus to cash flow instead of sales growth; and 3) They are managed by CEOs with significant ownership stakes (e.g., PUBM/SPOT/FTCH founders all own over 10% of their companies today). The stock prices continued to decline as we bought shares throughout 2022, resulting in roughly 18% of the net losses for the year (0% realized).1 Importantly, we invested in these businesses based on 2024-2025 fundamental expectations, and we would gladly increase our ownership stake at the appropriate price.
- China: Way Too Early for Our Recovery Investment — Early in the 4th quarter of 2021, we invested in three Chinese tech companies, all of which have high margins, strong cash flow, minimal leverage, and #1 share in markets growing double digits. Unfortunately, our timing was one year too early, as Chinese businesses did not experience the post-COVID rebound that we thought would come in 2022. Even though we paid very low valuations for some of the best companies in all of China, their stock prices still continued to fall throughout the year. This error cost us ~14% of net losses for the year (100% realized).1
As of year end, our portfolio2 trades for 13.8x forward earnings (2023E), and earnings expectations have been revised down anywhere from 10%-25% depending on the company. Said differently, we are no longer paying a high multiple of peak earnings like we were at the beginning of last year. This makes us excited about our future return prospects, especially given the potential growth of our investments over the next two to three years. The portfolio yields roughly 3.1%, generates an ROE of 16%, and is composed of premier businesses run by exceptional managers who are focused on creating value.
2022: The Great Reset of Interest Rates and Valuation
2022 is best summarized as the “Great Reset” of market expectations. The year marked a reversal of certain key factors that investors had previously become accustomed to, including low interest rates, low inflation, and globally coordinated economic growth. Unsustainable manias that resulted from cheap money (meme stocks, crypto, NFTs) are now disappearing, much to the chagrin of those who proclaimed that “old school” value investing was boring, or even dead. Nevertheless, the past 12 months have created massive fatigue for nearly all market participants; in fact, research firm Bespoke highlighted that 2022 was the first year in history when AAII bullish sentiment readings remained below the long-term average every single week.
Another manifestation of the “Great Reset” is extreme risk-off positioning. According to the BofA Global Fund Manager Survey, the relative positioning in stocks versus bonds is now the lowest it has been since 2009. The tech sector was the posterchild of cheap money, as nearly unlimited access to capital fueled rapid sales growth for companies with unviable business models and no cash flow. This resulted in many companies (representing nearly $14 trillion of combined market cap at one point) trading for over 10x sales—an overly optimistic valuation level that Scott McNealy, former CEO of Sun Microsystems, ridiculed back in 2002 after the dotcom bust:
“At 10 times revenues, to give you a 10-year payback, I have to pay you 100% of revenues for 10 straight years in dividends. That assumes I can get that by my shareholders. That assumes I have zero cost of goods sold, which is very hard for a computer company. That assumes zero expenses, which is really hard with 39,000 employees. That assumes I pay no taxes, which is very hard. And that assumes you pay no taxes on your dividends, which is kind of illegal. And that assumes with zero R&D for the next 10 years, I can maintain the current revenue run rate. Now, having done that, would any of you like to buy my stock at $64? Do you realize how ridiculous those basic assumptions are? You don’t need any transparency. You don’t need any footnotes. What were you thinking?”
CHART 1: Univ. of Michigan Sentiment Index at Inflection Point
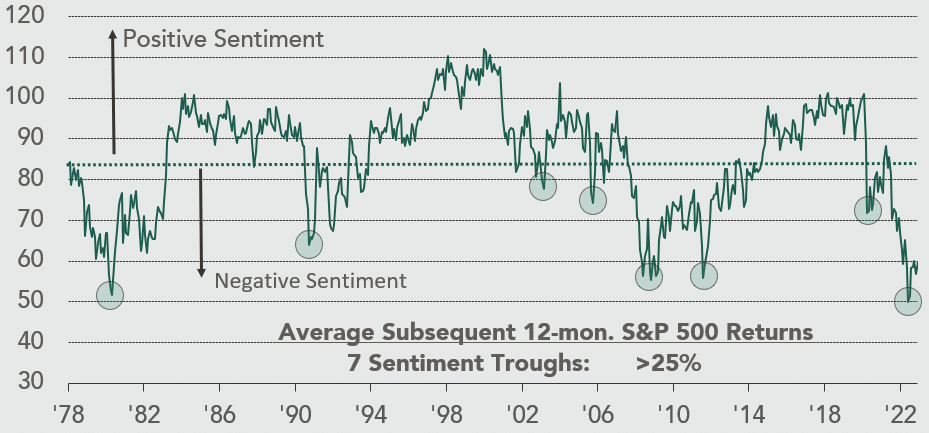
Source: J.P. Morgan Asset Management, Bloomberg. Data through Dec. 31st, 2022.
Tech investors began using phrases like “bond proxy” to describe these stocks as long-duration cash flow substitutes. This connection between rapidly rising stock prices and low (and declining) interest rates was sustained when trends reversed. Rising interest rates resulted in roughly $7 trillion of value destruction among Nasdaq companies in 2022. Some companies will likely experience even more pain ahead, especially those grouped in with the 40% of Russell 2000 constituents that are not generating any earnings today.
Where will interest rates plateau? Will interest rates go down next year? Will higher rates create a recession? While all of these are great questions, we’d be lying if we pretended to know the answers. Our time is better spent on what we call “productive worrying.” This involves thinking about factors within our control and answering questions such as: Do our companies have fortress balance sheets that can withstand a recession? Are they run by excellent leaders who have successfully managed through difficult environments in the past? Are they taking advantage of current dislocations to better position themselves when we come out the other side? These types of qualitative and quantitative assessments serve as our preferred litmus test for evaluating overall portfolio durability. They are what gives us confidence to stand underneath our arch during unpredictable times.
Decade of Indexing Switches to Active and Decade of Growth Switches to Value?
Another inflection point witnessed in 2022 was passively managed funds surpassing active funds as a percentage of owned market cap. According to the Investment Company Institute, passive funds now account for 16% of U.S. market capitalization versus only 14% held by active funds (down from 20% 10 years ago). A recent paper written by Alex Chinco and Marco Sammon argues that passive funds might actually own closer to 40% of the market, based on an analysis of dollars traded on index reconstitution days. On days when constituents were added/removed from certain indexes, Chinco and Sammon measured over six times more trading volume than what was required by index tracking ETFs for regular rebalancing. Who accounts for the difference in volume? Closet indexing institutions like pensions and endowments that are managing their money internally and not using mutual fund or ETF products. These “shadow-passive” portfolio managers have increasingly become bigger players in the market as active management continues to be scorned. The rise of “shadow-passive” investors who allocate each incremental dollar of capital to the S&P 500 may be contributing to the index’s growing concentration over time. Recall that the top five names in the S&P 500 hold a combined weight of more than 22% of the index. Not even in 2000 did the S&P become this concentrated (the top five weighting peaked back then at around 17%).
CHART 2: S&P 500 Index: Equal Weighted (EW) vs. Market Cap Weighted (MCW) 2006-2022
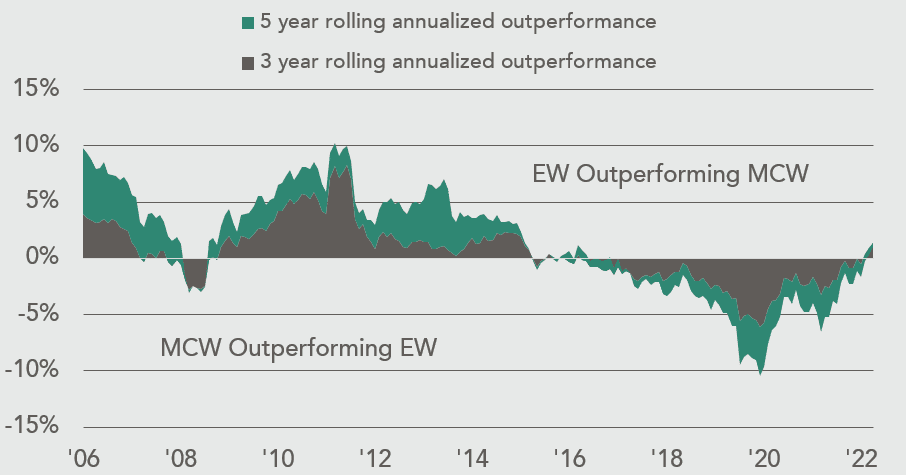
Source: Bloomberg. For illustrative purpose only. Past performance does not guarantee future results. Data through Dec. 30th, 2022.
Historically, once this level of index concentration is observed, what follows are often multi-year periods of relative outperformance of “equal weighted” comparable indexes. Simply said, the winners that drove the index in the past do not end up becoming primary contributors of return in the future. As shown in CHART 2, the outperformance of the cap-weighted S&P 500 index over the past seven years (driven mostly by FAANG stocks) is starting to reverse. This is a trend which should create an environment that benefits stock pickers.
CHART 3: Russell 1000 Index: Value vs. Growth (1983 – 2022)
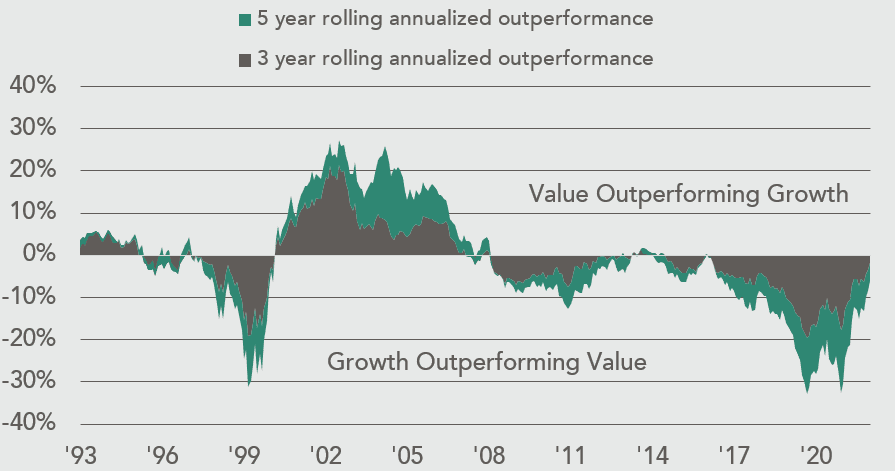
Source: Bloomberg. For illustrative purpose only. Past performance does not guarantee future results. Data through Dec. 30th, 2022.
A similar dynamic is also observed when comparing the relative performance of growth versus value stocks over time. CHART 3 shows that growth has experienced more than a decade of outperformance over value, with the greatest relative spread occurring during 2021. However, this trend has recently begun reverting, and over the past 12 months value has outperformed growth by an astounding 21 percentage points. Growth’s recent underperformance is fairly easy to explain, as growth stocks (especially unprofitable ones) have been disproportionately hurt by rising interest rates. We believe that CHART 2 and CHART 3 make a compelling case for allocating capital to active value strategies today. Time will tell if the successful growth indexing strategies of the last decade will succumb to a new active regime, but one thing holds true at least for now – value clearly has momentum on its side.
Closing Thoughts
When we originally opened the doors to our firm, we said we wouldn’t follow the institutional imperative. We would not manage money according to style boxes (growth vs. value or small cap vs. large cap) as that would detract from our central mission to “Go make money.” As the world changed over the last decade, we have invested in all different “style boxes” – always trying to remain opportunistic by investing in the highest quality companies with the most attractive risk/reward characteristics.
We are excited about the opportunities that lie ahead and remain open to both new and existing investors who wish to place more capital with us. We appreciate your patience during this time and leave you with the following story from Ryan Holiday’s “The Obstacle is the Way”:
“There is an old Zen story about a king whose people had grown soft and entitled. Dissatisfied with this state of affairs, he hoped to teach them a lesson. His plan was simple: He would place a large boulder in the middle of the main road, completely blocking entry into the city. He would then hide nearby and observe their reactions. How would they respond? Would they band together to remove it? Or would they get discouraged, quit, and return home? With growing disappointment, the king watched as subject after subject came to this impediment and turned away. Or, at best, tried halfheartedly before giving up. Many openly complained or cursed the king or fortune or bemoaned the inconvenience, but none managed to do anything about it. After several days, a lone peasant came along on his way into town. He did not turn away. Instead he strained and strained, trying to push it out of the way. Then an idea came to him: He scrambled into the nearby woods to find something he could use for leverage. Finally, he returned with a large branch he had crafted into a lever and deployed it to dislodge the massive rock from the road. Beneath the rock were a purse of gold coins and a note from the king, which said: ‘The obstacle in the path becomes the path. Never forget, within every obstacle is an opportunity to improve our condition.’”
Sustine et. Abstine,
The Nixon Capital Team
1 Reflects net returns incurred if invested in the model portfolio for the entirety of 2022. Actual client returns may vary. A summary of portfolio performance net of a 1% management fee for 2022 will be provided upon written or verbal request.
2 Statistics reflect the model portfolio as of 12.31.2022. Values are calculated using a portfolio weighted average. Data excludes portfolio positions with nonapplicable and/or incalculable values. All data is based on a time observation and are subject to change. Actual client statistics may vary. Additional information will be provided upon request.
Any views expressed are subject to change at any time, and Nixon Capital disclaims any responsibility to update such views. Information contained herein has been obtained from various sources believed reliable but is not necessarily complete. Accuracy is not guaranteed. Nixon Capital has not reviewed any of the websites that may be linked to this letter and is not responsible for their content. Nixon Capital is not responsible for the privacy practices of such other websites. Discussions of individual securities are intended to inform shareholders as to the basis (in whole or in part) for previously made decisions by the firm to buy, sell or hold a security in a portfolio. References to specific securities are not intended and should not be relied upon as the basis for anyone to buy, sell or hold any security. Portfolio holdings and asset allocations may not be representative of the portfolio manager’s current or future investment and are subject to change at any time. This information is not to be reproduced or redistributed to any other person without the prior consent of Nixon Capital LLC.