“It is difficult to get a man to understand something, when his salary depends upon his not understanding it.”
Overview of Stock-Based Compensation
Stock-based compensation (“SBC”) is compensation that is based on the value of a company’s equity. It can take the form of securities bearing an equity interest in the company or obligations to pay cash in an amount based on the value of the company’s equity. The latter forms are treated as liabilities since they are settled in cash, while the former are treated as equity. Since equity-classified SBC affects share count, investors can be diluted by the practice and should understand its impact. This paper is intended to serve as a guide to understanding SBC from an investor’s perspective and will focus on equity-classified SBC.
Equity-classified SBC includes restricted stock, restricted share units (“RSUs”)[a] and options, as well as variations of these instruments characterized by their vesting conditions. The most common vesting condition is time, whereby the employee can sell or exercise the security after they have worked at the company for a certain period. Vesting conditions can also be based on financial or operating performance targets or the performance of the stock itself. RSU’s have gradually replaced options as the dominant form of SBC, partly because accounting standards were updated in 2006 to require companies to expense options at fair value.1
The accounting standards for SBC are known today as ASC 718. Since 2006, grants of SBC are valued as of the grant date at fair value and recognized as an expense over their “requisite service period”, which is the period between the grant date and the date when the vesting conditions are expected to be met. Fair value for restricted shares and RSUs is typically the share price, while for options it is determined using an option pricing model.2
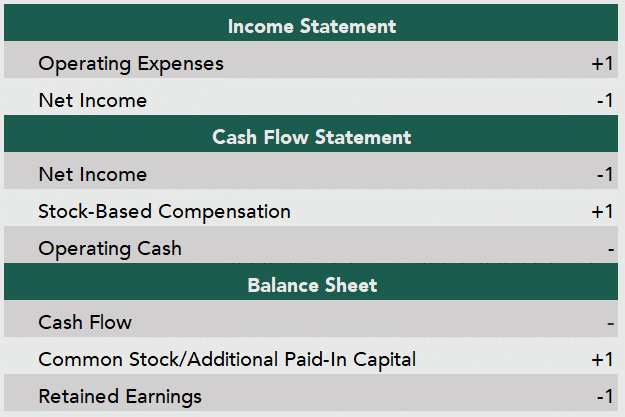
In the income statement SBC is a component of operating expenses, and in the cash flow statement it appears in the operating section as a non-cash expense added back to net income. The effect of SBC on the balance sheet is a decrease to retained earnings and an increase to common stock and additional paid-in capital:
TABLE 1: Impact of Additional $1 in SBC
How to treat SBC when valuing companies is a matter of increasing salience to investors. The Street would tell you that SBC should be added back to net income in the calculation of free cash flow (“FCF”) because it is non-cash. Skeptics would argue that, by doing this, FCF becomes practically meaningless for companies like Palantir and Snowflake that report massive amounts of SBC:
TABLE 2: Revenue, FCF and SBC for 12-Months Ending 9/30/2022 ($ Millions)
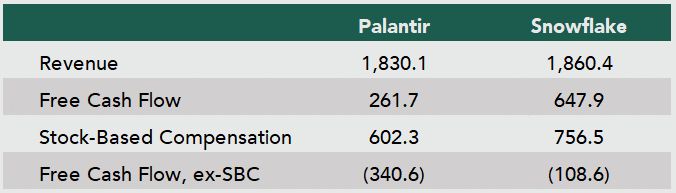
Source: S&P Global. For illustrative purposes only.
This paper will show that companies that report high levels of SBC tend to deliver inferior returns to investors. Accordingly, the valuation process should account for SBC’s impact with adjustments to both FCF and share count.
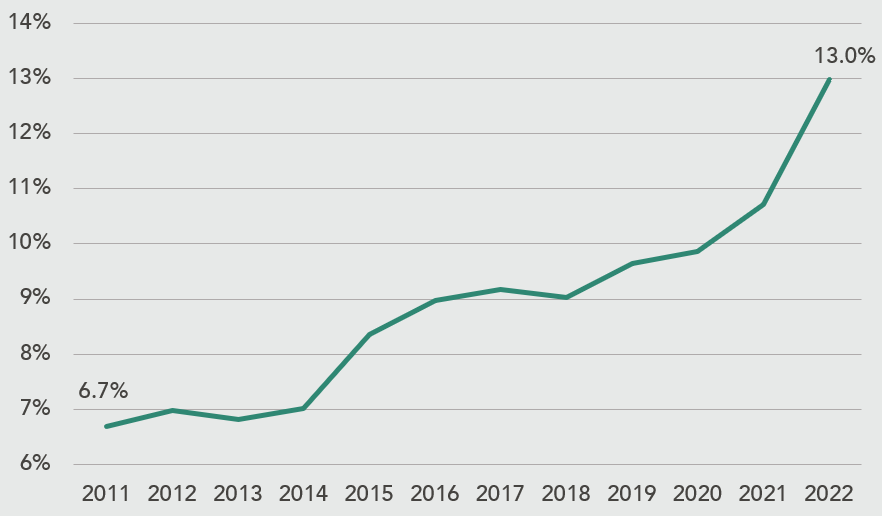
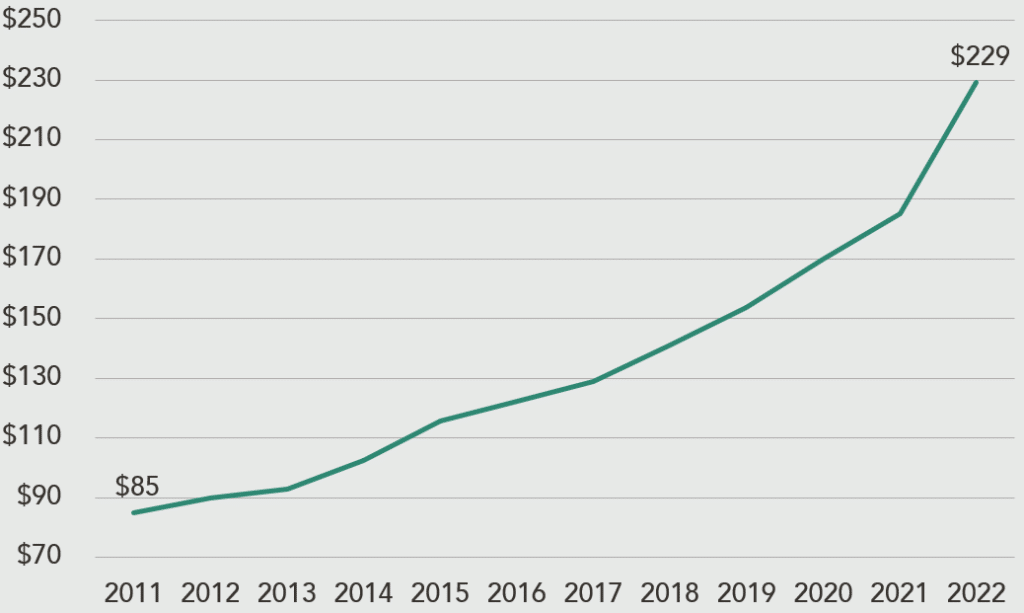
One thing to note about SBC is that there is a lot more of it, highlighting the importance of understanding its impact on investor returns. The average ratio of SBC to operating expenses has nearly doubled since 2011:
CHART 1: Average SBC/Operating Expense Ratio, Russell 3000 Constituents, 2011-2022
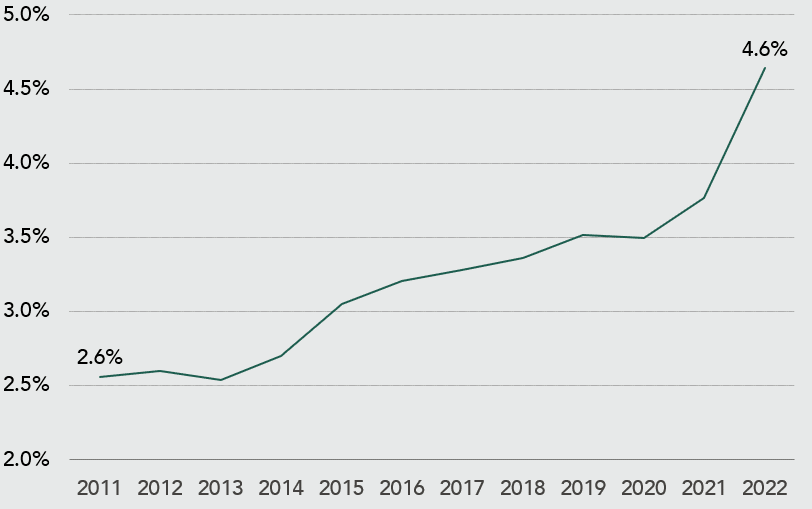
Source: S&P Global. For illustrative purposes only.
[a] Restricted stock is a share that has been delivered but cannot be sold until vesting conditions have been met, while an RSU is a contract to deliver a share in the future once vesting conditions have been met.
Stay up to date
Subscribe to receive our quarterly investor letters and market updates.

SBC From Management’s Perspective
In compensating employees with equity, management is choosing to conserve cash and inflate share count instead. For management this is a financing decision, implying a judgement that employees are a cheap source of equity capital. SBC can be very useful for companies that want to grow quickly without burning a ton of cash.
SBC is also supposed to be good corporate governance. As the thinking goes, giving executives exposure to the company’s equity aligns their interests with investors and solves the classic principal-agent problem, although this is not well supported by research.3,4 At best, the effectiveness of SBC at aligning interests is an open question. Theoretically, SBC should not affect investor returns, but this assumes that it is being traded for cash compensation at fair value, which is a premise that requires scrutiny.
Why SBC Might Lower Investor Return
Investors suffer economic dilution when equity is sold at a discount to fair value because this increases share count more than it increases the equity value of the firm, thus lowering the per-share value of each investor’s stake. Therefore, for SBC to be non-dilutive, workers must implicitly value the company’s equity fairly when negotiating pay. However, there is reason to doubt whether this condition holds. One study estimated that executives value their options at 53 to 70 cents on the dollar.5
For example, suppose that a company’s stock trades at $100 per share. A worker who values the company’s equity fairly will consider the following two offers equivalent:
TABLE 3: Employee Values Equity Fairly

The value of equity awarded in Offer 1 equals the amount of cash saved by the company. Because the worker is indifferent to receiving cash or stock in these amounts, Offer 1 is non-dilutive. Now suppose the worker values the company’s equity at a steep discount, say at $50 per share, and considers the following two offers equivalent:
TABLE 4: Employee Values Equity at a Discount

In this scenario, Offer 1 awards $100,000 in equity to save only $50,000 in cash compared to Offer 2, overpaying the worker and diluting investors, ceteris paribus. The reason why this might be the rule rather than the exception comes down to diversification.
Workers and outside investors are both assumed to be risk-averse, meaning they value risky payouts at less than expected value and discount investment opportunities accordingly. But investors have a powerful tool at their disposal to mitigate investment risk: diversification. Holding a well-diversified portfolio reduces the firm-specific component of investment risk that investors are exposed to. This reduces their total risk, now composed mostly of the unchanged systematic component, and in turn lowers their required rate of return.
Workers bargaining for pay do not have the ability to diversify their SBC since they only have one job at a time. Instead of mitigating firm-specific risk, they are concentrating it by wagering on the future of the same company that pays their salary and sponsors their health insurance. This concentration of firm-specific risk can lead workers to require a higher rate of return on their employer’s equity than outside investors, and thus to value it more cheaply and demand more of it to forgo a given amount of cash. Workers are overpaid in shares to save cash, et voilà, dilution.
Twitter: A Case Study in Excessive SBC
Twitter was one of Silicon Valley’s most enthusiastic purveyors of stock-based compensation for many years. It went public in November of 2013, had a market cap of $24.5 billion as of the close on the day of its IPO, and was taken private nine years later by Elon Musk at a market cap of $41.4 billion. That is an increase in market cap of 69%, measured from the IPO day close. However, the stock only went up 21%, despite revenue and profit increasing respectably:
TABLE 5: Twitter’s Growth From IPO to Acquisition
Source: S&P Global. For illustrative purposes only.
Given Twitter’s growth, how could an investor on Day 1 earn only a 2% annualized return over nine years? Of course, multiple compression explains part of it: as Twitter matured, its price-to-sales ratio declined from 46 to 8. But dilution also played a major role. Twitter’s share count increased by 40% over the period, reducing cumulative return by almost 70%:
TABLE 6: Decomposition of Twitter’s Return
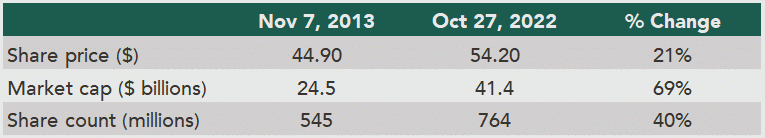
Source: S&P Global. For illustrative purposes only.
Twitter’s generous SBC policy resulted in 252 million shares being issued between IPO and exit, accounting for 90% of the gross increase in the company’s share count and 31% of final gross share count:
CHART 2: Decomposition of Twitter’s Share Count (Millions)
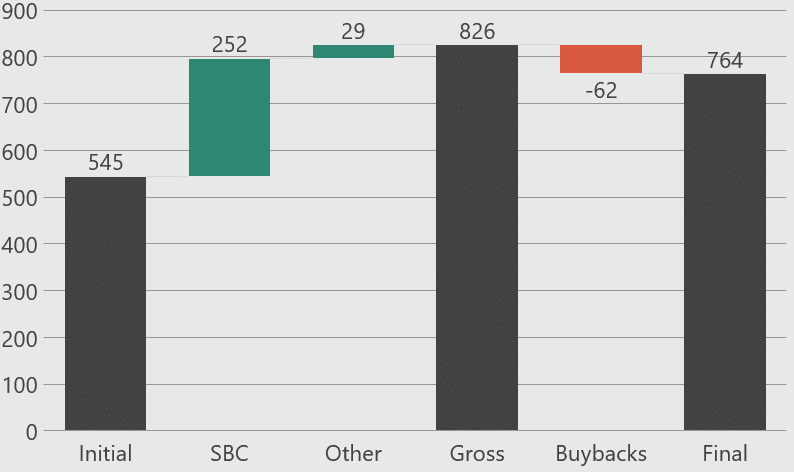
Source: S&P Global. For illustrative purposes only.
SBC expense totaled $5.2 billion over the period and proceeds from option exercises were $81 million, meaning Twitter employees and executives “invested” about $5.3 billion. In return, they were awarded 31% of Twitter’s equity, or $13.6 billion of the $44.5 billion gross exit value. That is more than $2.7 million per employee and roughly 68% of the $20 billion in equity value created:
CHART 3: Decomposition of Twitter’s Market Cap ($ Billions)
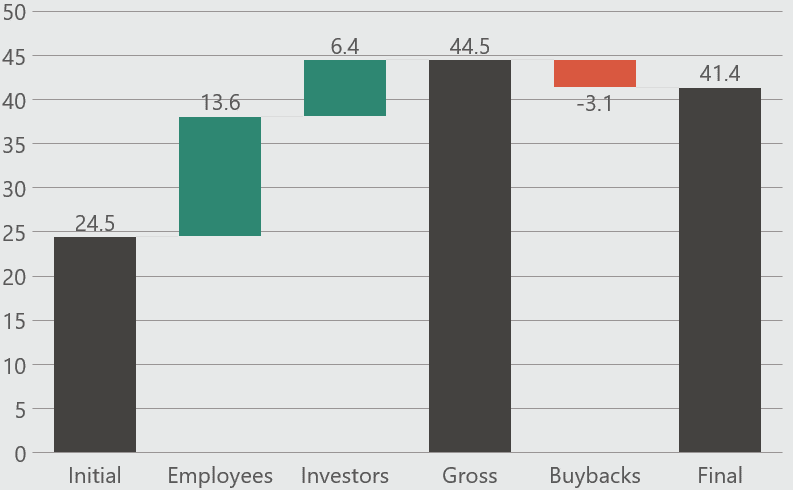
Source: S&P Global. For illustrative purposes only.
Key Question: Does SBC Negatively Affect Investor Returns?
The Twitter example illustrates that SBC can indeed lower investor return via dilution, but that is only one case. If SBC were generally dilutive to investors, one would expect companies reporting high levels of SBC to generally deliver inferior returns.
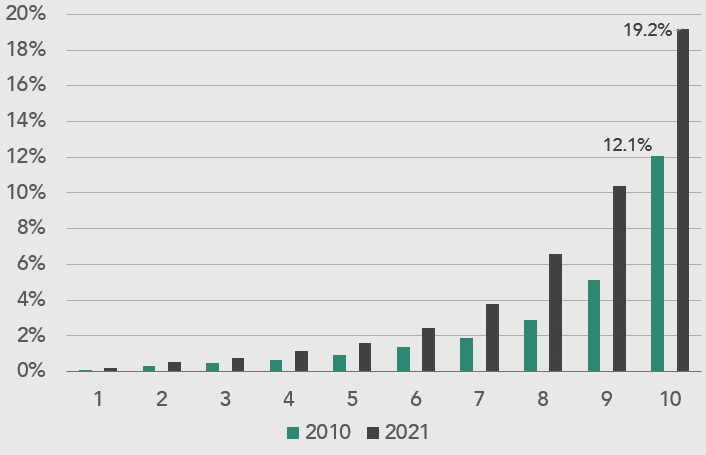
To test this hypothesis, I investigated the effect of SBC intensity, as measured by 3-year trailing SBC-to-operating expense ratio (“SBC/OpEx”), on 1-year ex-post total returns of Russell 3000[b] constituents from 9/30/2010 to 9/30/2022. Return data assumes annual rebalancing on 9/30 with no trading costs. SBC awards typically vest over several years, hence the 3-year trailing measure.
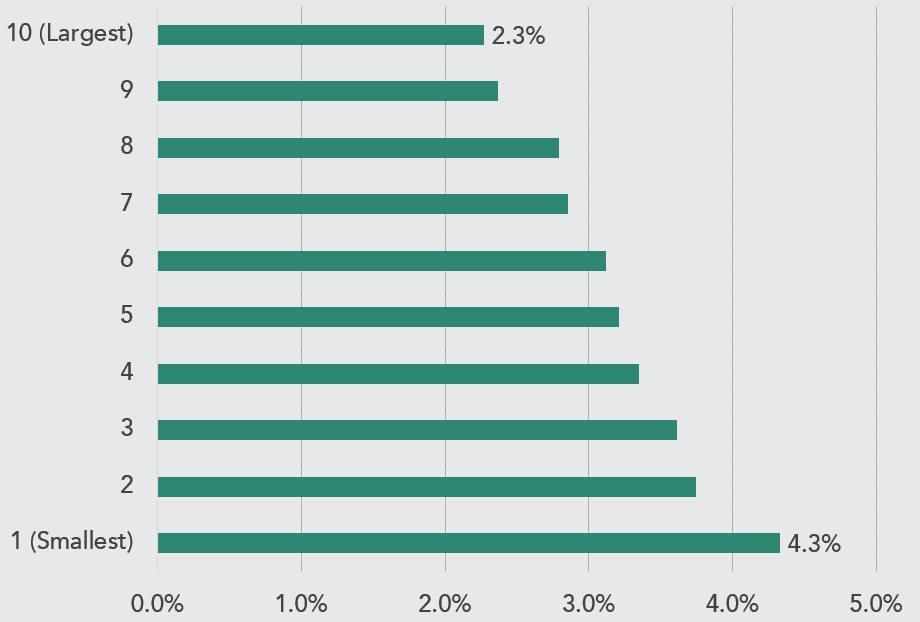
The decision to scale SBC to operating expenses (inclusive of Cost of Goods Sold), instead of to revenue or market cap, was warranted by the fact that 1) many early-stage companies have deceptively little revenue and 2) market cap captures ex-ante valuation, which would obscure the effect of SBC on returns. Note the left tail in the distribution of SBC/OpEx ratio, and the large increase since 2010:
CHART 4: Average SBC/OPEX Ratio for Russell 3000 Constituents, by SBC/OPEX Decile, 2010 and 2021
Source: S&P Global. For illustrative purposes only.
[b] The iShares® Russell 3000 ETF was used as a proxy for the Russell 3000 Index. The Russell 3000 Index is a market-capitalization-weighted equity index maintained by FTSE Russell that provides exposure to the entire U.S. stock market. The index tracks the performance of the 3,000 largest U.S.-traded stocks representing approximately 96% of the investable U.S. Equity market.
Key takeaways from the analysis are as follows:
1. SBC/OpEx Negatively Affects Investor Returns
High-SBC companies, defined as Russell 3000 constituents in the top decile of SBC/OpEx on a rolling three-year basis, had the lowest annualized total returns. The assumption here is that each decile is an equal-weighted portfolio rebalanced annually on 9/30 and with no trading costs. The effect is only noticeable in the top decile, suggesting a tipping point at 7-13% SBC/OpEx (see Chart 11 in appendix), beyond which returns start to suffer:
CHART 5: Annualized Total Return, by SBC/OpEx Decile, Russell 3000 Constituents, 2010-2022
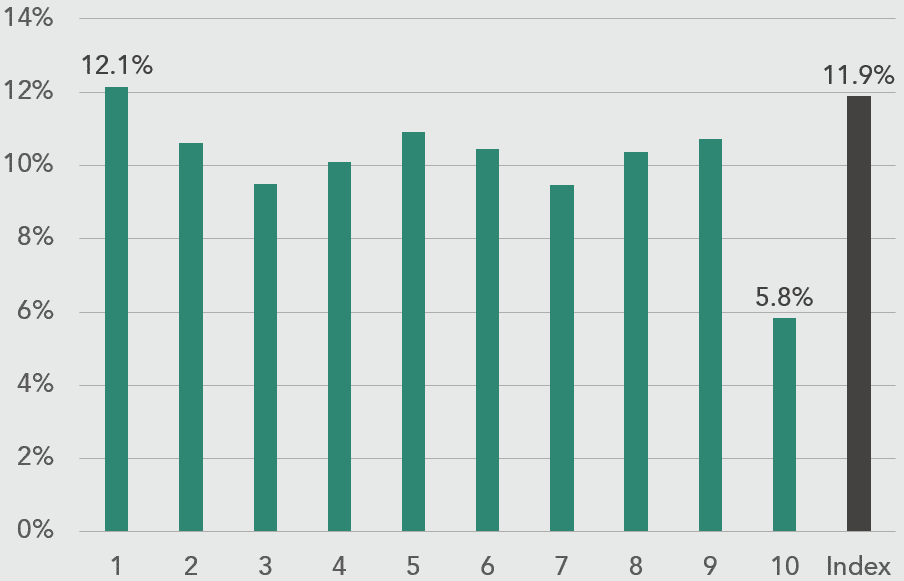
Source: S&P global. For illustrative purposes only. Past performance does not guarantee future results.
Another observation is that companies in the bottom decile, those with little to no SBC, performed the best. This finding was not anticipated, but it suggests that SBC might not work that well as an incentive. Since every company uses some form of performance pay to incentivize their key employees, the companies in the bottom decile here – those with SBC/OpEx of less than 0.35% in 2022 – must be those that use other forms of incentives, such as cash bonuses for meeting certain operating or financial targets, instead of SBC.
This shouldn’t come as a surprise. To paraphrase Benjamin Graham, sentiment may drive equity returns in the short run, but in the long run fundamentals rule. Since vesting periods are not typically that long, executives know that the fate of their SBC is mostly determined by factors outside their control, such as the state of the economy, investor sentiment, pandemics, etc.
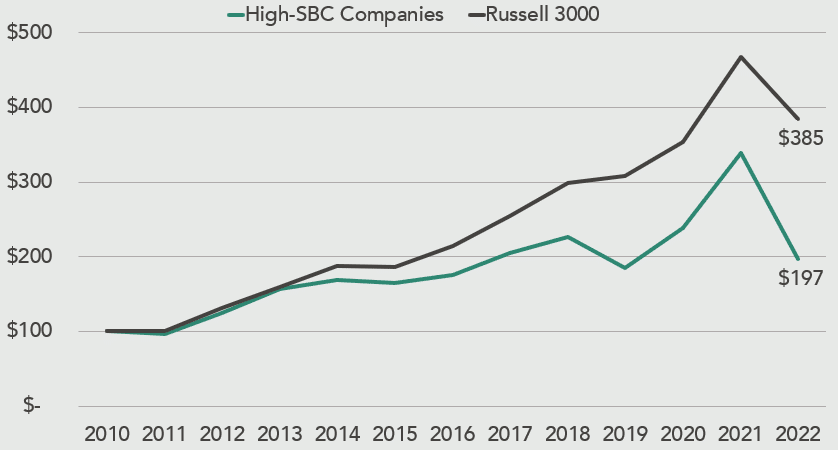
The high-SBC portfolio lagged the index in 9 of 12 years, returning 5.8% annualized versus 11.9% for the Russell 3000. Again, the assumption here is for equal-weighted portfolios rebalanced annually on 9/30 and with no trading costs. $100 invested in the high-SBC portfolio from 2010 to 2022 would have resulted in only $197 at the end of the period, compared to $385 had the money instead been indexed (CHART 6):
CHART 6 – Cumulative Return of $100, High-SBC Portfolio vs Russell 3000 Index, 2010-2022
Source: S&P Global. For illustrative purposes only. Past performance does not guarantee future results.
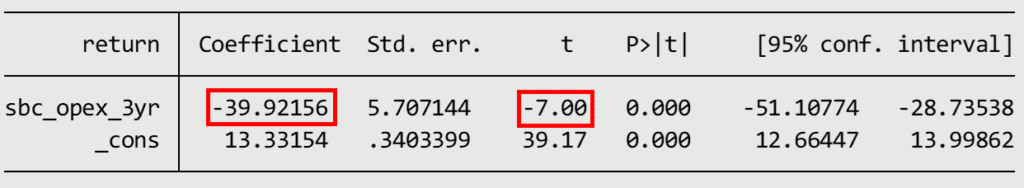
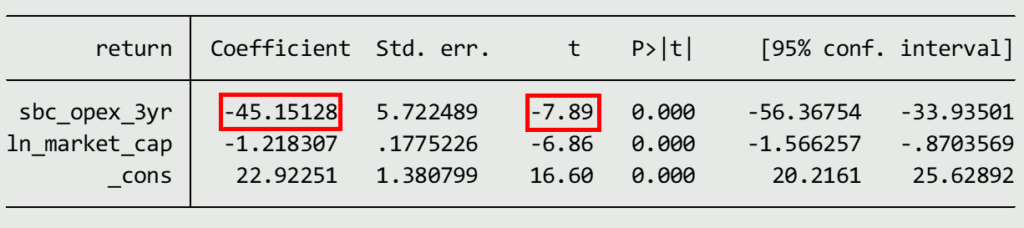
The negative relationship between SBC/OpEx and total return is confirmed by a regression (TABLE 7). The target variable total return is explained by the explanatory variable SBC/OpEx. The negative sign on the coefficient for SBC/OpEx indicates that it has a negative relationship with total return. The highlighted t-score of -7 means the estimated effect is 7 standard deviations below 0, indicating greater than 99.99% confidence of a negative relationship:
TABLE 7 – Total Return Regressed on SBC/OpEx
Source: S&P Global. For illustrative purposes only. Past performance does not guarantee future results.
The highlighted coefficient of -39.9 indicates that an additional 100 basis points of SBC/OpEx lowers estimated total return by 40 basis points, meaning a company with SBC/OpEx of 10% should return about 4% less per year than a company with no SBC, holding all else fixed.
2. SBC/OpEx Still Negatively Affects Investor Returns After Controlling for Industry
One might ask whether the analysis above is simply capturing industry effect. To control for this, I calculated industry-relative return for each company. Industry-relative return is a company’s own return for a given year minus the average return for its industry. For example, if Citi’s stock returned 15% in a year when banks returned 10% on average, Citi’s industry-relative return for that year is positive 5%.
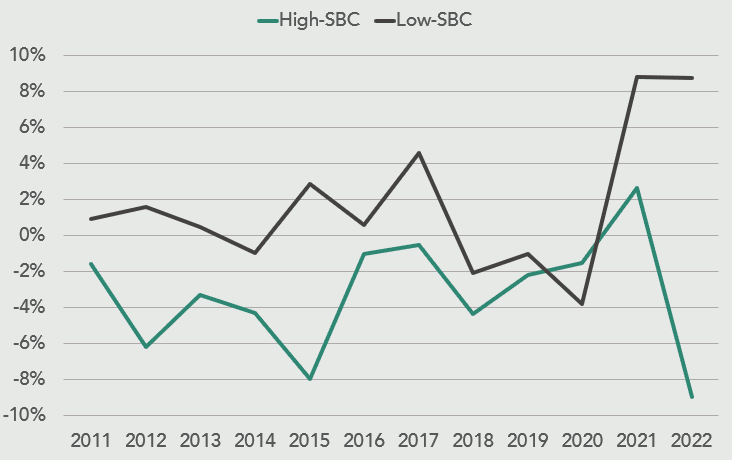
After controlling for industry, the results are the same. Companies with the highest SBC/OpEx performed the worst relative to their respective industry averages, and companies with the lowest performed the best:
CHART 7: Average Industry-Relative Return, by SBC/OpEx Decile, 2010-2022
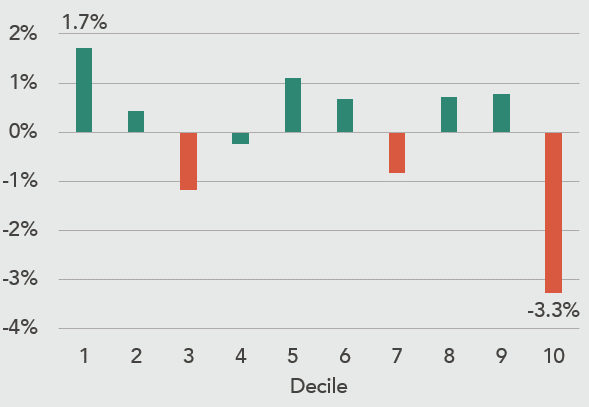
Source: S&P Global. For illustrative purposes only. Past performance does not guarantee future results.
The negative relationship between SBC/OpEx and total return is confirmed again by a regression, this time controlling for industry return (TABLE 8). In this regression, the effect of industry return is controlled for by including it as an explanatory variable alongside SBC/OpEx. Again, the negative sign on the coefficient for SBC/OpEx indicates that it has a negative relationship with total return. The highlighted t-score of -4.7 means the estimated effect is 4.7 standard deviations below 0, indicating greater than 99.9% confidence of a negative relationship:
TABLE 8 – Total Return Regressed on SBC/OpEx and Industry Return
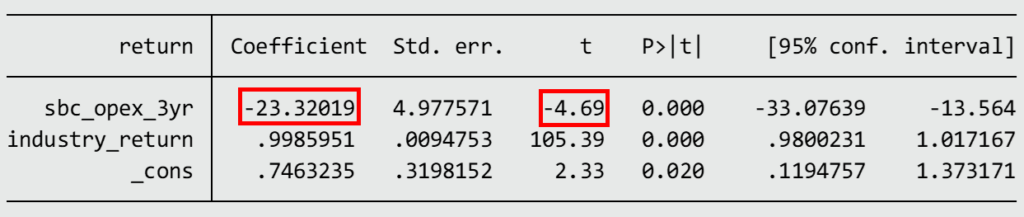
Source: S&P Global. For illustrative purposes only. Past performance does not guarantee future results.
The highlighted coefficient of -23.3 indicates that an additional 100 basis points of SBC/OpEx lowers estimated total return by 23 basis points, meaning a company with SBC/OpEx of 10% should return 2.3% less per year than a company with no SBC, holding all else fixed.
3. The Negative Effect of SBC/OpEx on Investor Returns is Driven by Small- and Mid-Caps
An important thing to note about SBC is that small companies rely on it more than large companies:
CHART 8: Average SBC/OpEx, by Market Cap Decile, 2010-2021
Source: S&P Global. For illustrative purposes only.
There is a clear linear relationship between market cap and SBC/OpEx, with smaller companies reporting higher ratios than larger companies. For this reason, it is necessary to control for market cap to confirm the negative relationship between SBC/OpEx and return. For this analysis, large-caps are defined as the top two deciles in market cap, mid-caps are the 7th and 8th deciles, and small-caps are the bottom 6 deciles. High-SBC companies are those in the top decile in SBC/OpEx, mid-SBC companies are those in the 5th to 9th deciles, and low-SBC companies are those in the bottom 4 deciles. In 2022, the market cap ranges were > $13.6 billion for large-caps, $4.6 billion to $13.6 billion for mid-caps and < $4.6 billion for small-caps, and the SBC/OpEx ranges were > 13% for high-SBC, 1.9% to 13% for mid-SBC and < 1.9% for low-SBC.
High-SBC small- and mid-caps noticeably trailed the index from 2010 to 2022. Again, the assumption here is for equal-weighted portfolios rebalanced annually on 9/30 and with no trading costs. High-SBC small-caps lagged by a very significant 730bps per year:
CHART 9 – Annualized Total Return, by SBC/OpEx and Market Cap, Russell 3000 Constituents, 2010-2022
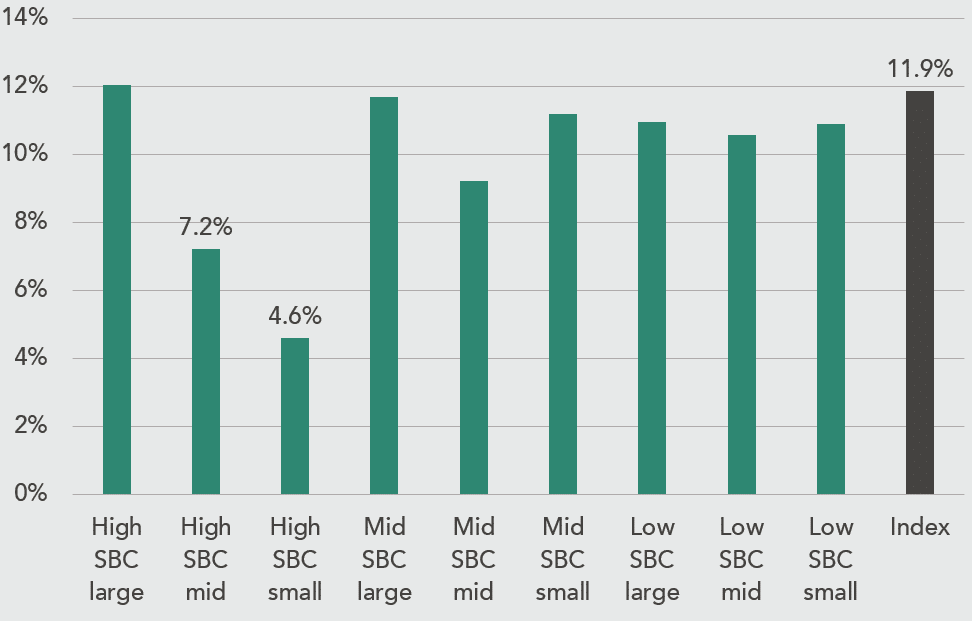
Source: S&P Global. For illustrative purposes only. Past performance does not guarantee future results.
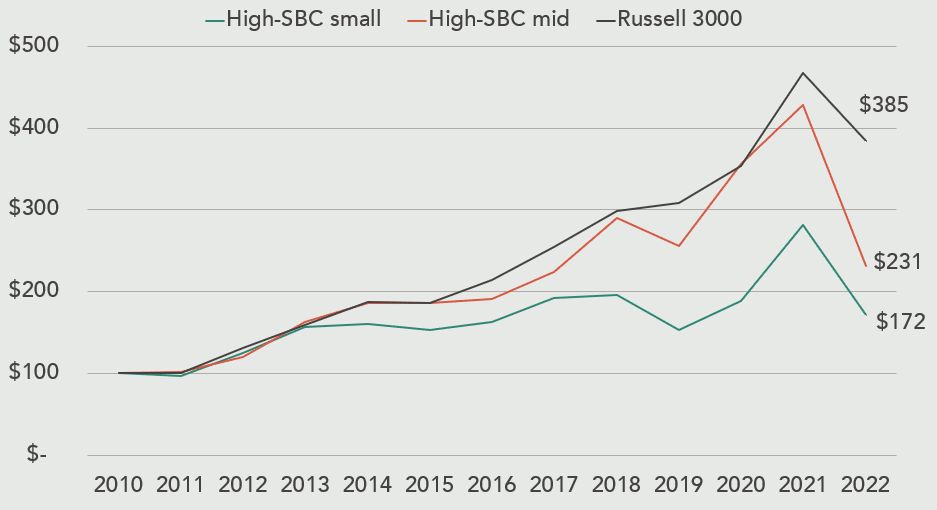
The high-SBC small-caps portfolio lagged the index in 11 of 12 years, returning 4.6% annualized versus 11.9% for the Russell 3000. A $100 investment in the high-SBC small-cap portfolio would have grown to only $172 at the end of the 12-year period, compared to $385 had the money instead been indexed (CHART 10):
CHART 10 – Cumulative Return of $100, High-SBC Small-Caps vs High-SBC Mid-Caps vs Index, 2010-2022
Source: S&P Global. For illustrative purposes only. Past performance does not guarantee future results.
The negative effect of SBC/OpEx on total return is again confirmed by a regression, this time controlling for market cap (TABLE 9). In this regression, market cap is controlled for by including it as an explanatory variable alongside SBC/OpEx. Again, the negative sign on the coefficient for SBC/OpEx indicates a negative relationship with total return. The highlighted t-score of -7.9 means the estimated effect is 7.9 standard deviations below 0, indicating greater than 99.99% confidence of a negative relationship:
TABLE 9 – Total Return Regressed on SBC/OpEx and Market Cap
Source: S&P Global. For illustrative purposes only. Past performance does not guarantee future results
The highlighted coefficient of -45 indicates that an additional 100 basis points of SBC/OpEx lowers estimated total return by 45 basis points, meaning a company with SBC/OpEx of 10% should return 4.5% less per year than a company with no SBC, holding all else fixed. The results in (CHART 9) suggest that small- and mid-caps in the sample are driving this effect. The fact that only small- and mid-caps demonstrate a negative relationship between SBC/OpEx and total return has several possible explanations. The most obvious is informational efficiency. Large caps are more closely scrutinized by investors and so their market prices more completely reflect information. To put it another way, dilution arising from SBC is more likely to be priced-in for large-caps because analysts pay closer attention to them.
Another possibility is that small- and mid-caps have more firm-specific risk than large-caps, leading their employees to discount the company’s equity relatively more than employees of large companies due to non-diversification. A third explanation is that smaller companies, having inferior access to capital markets, are compelled to rely on SBC as a financing necessity to the point that it becomes value-destroying. Finally, it is possible that outliers in the data are to blame. For example, Moderna Therapeutics returned 444% in 2020, accounting for nearly all the outperformance of high-SBC large caps in that year.
How to Approach SBC in Valuation
Given that SBC negatively affects investor returns, it can’t be ignored when valuing companies. This should be intuitively obvious: compensation is a real expense, so it matters whether it is paid in cash or equity.
In his 1986 shareholder letter, Buffett offered a critique of FCF highlighting its potential to exclude capital reinvestment sufficient to maintain competitive position.7 For example, management of an airline could instantly boost FCF by simply declining to replace older planes. This would tend to erode the business over time, reducing future cash generating potential and thus the present intrinsic value of the firm. Buffett introduced a preferred measure he calls owners’ earnings, which subtracts an estimate for maintenance CapEx from operating cash to reflect the objective cost of maintaining competitive position and internally stabilizing intrinsic value.
The argument to adjust FCF for SBC rests on similar logic: for FCF to be a valid basis for valuation, it should represent a residual left over after per-share intrinsic value has been internally stabilized. If an operating expense, in this case compensation, creates dilution that would require a cash outflow to offset, FCF should be adjusted to reflect this. As with depreciation, when a non-cash expense is added back to net income, an allowance must be made for the corresponding cash leg.
There are two alternative methods for handling SBC in DCF-based equity valuation. The assumption here is that FCF has initially been calculated in the typical way, with SBC added back to net income along with depreciation expense.
Damodaran approach:8
- Subtract SBC from free cash flow to the firm (“FCFF”) in DCF model > SBC-adjusted FCFF
- Discount SBC-adjusted FCFF > enterprise value
- Subtract net debt > equity value
- Subtract after-tax value of outstanding vested and unvested options > option-adjusted equity value
- Add vested and unvested restricted shares and RSUs to outstanding shares > diluted share count
- Divide option-adjusted equity value by diluted share count > estimated value per share
Treasury stock approach:
- Subtract SBC from FCFF in DCF model > SBC-adjusted FCFF
- Discount SBC-adjusted FCFF > enterprise value
- Subtract net debt > equity value
- Use treasury stock method to adjust share count for vested and unvested options, then add vested and unvested restricted shares and RSUs > fully-diluted share count
- Divide equity value by fully-diluted share count > estimated value per share
The only difference between the two methods is the way options are treated. In the Damodaran approach, options are valued after-tax and removed from the numerator. In the treasury stock approach, the dilutive effect of options is reflected in the denominator. The Damodaran approach is more precise, but also more complex, as it requires assumptions to be made regarding illiquidity and early exercise when valuing employee options. In companies with few options, the two approaches should yield comparable target prices. In either case, all unvested RSUs and options are assumed to vest.
It may seem wrong to adjust both FCF and share count for the effect of SBC, but this is not double counting. The adjustment to FCF accounts for the dilutive effect of future SBC, while the adjustment to share count accounts for dilution from previously awarded SBC.
One caveat to both approaches is the option to adjust FCF only partially for SBC. The rationale for not fully subtracting SBC from FCF goes back to the assumption that, because of risk-aversion, SBC overstates the amount of cash compensation that employees would demand if SBC were off the table. If employees value $2 in SBC the same as $1 in cash, then subtracting half of SBC from FCF would approximate “cash compensation only” FCF.
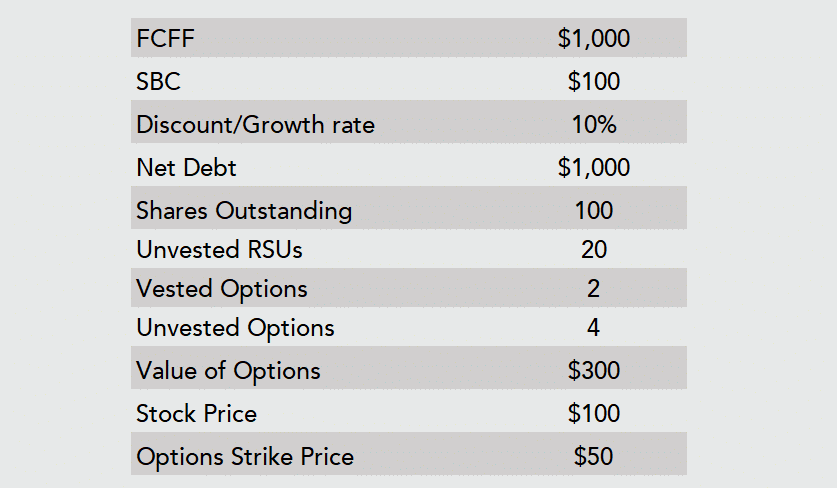
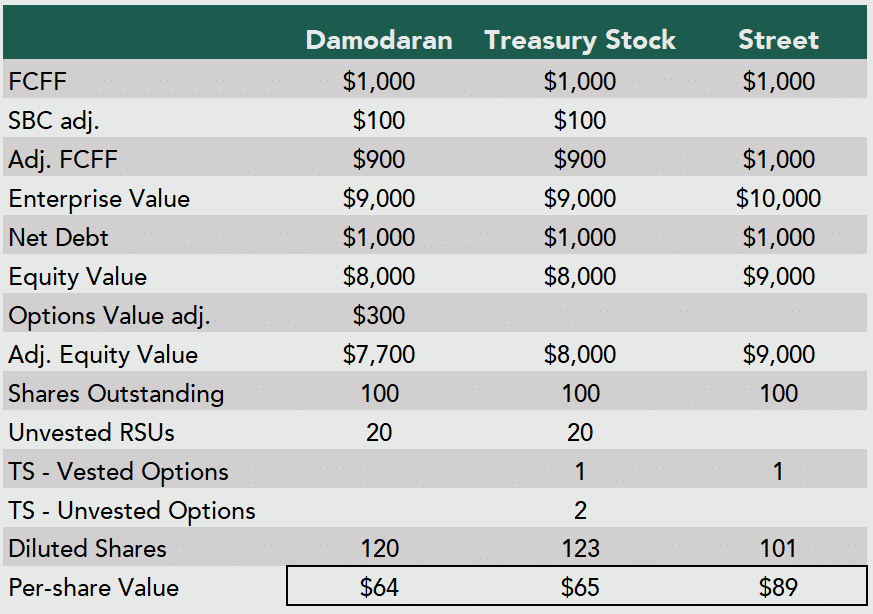
The table below shows a hypothetical valuation of the same company using the Damodaran and treasury stock approaches. Both methods suggest an equity value of $64-$65 per share, approximately 27% lower than the $89 per share valuation obtained if SBC is not properly accounted for:
TABLE 10 – Valuation Example (In Millions Per-Share Amounts)
For illustrative purposes only
Final Thoughts
The principal finding is that companies with higher SBC/OpEx ratios tend to underperform their peers, consistent with the hypothesis that SBC is dilutive to investors because employees can’t diversify firm-specific risk. Regression analysis indicates that an additional 100bp in SBC/OpEx lowers total return by 23-45bps, while decile means analysis suggests a tipping point in the range of 7-13% SBC/OpEx, beyond which investor returns appear to suffer.
The results are robust to industry and size effects, with the caveat that the negative effect of SBC/OpEx on total return appears limited to small- and mid-caps, defined in 2022 as companies with market caps of less than $13.6 billion. A secondary finding is that companies with little or no SBC tend to outperform their peers, suggesting that other forms of incentive pay may better serve investors.
Suggestions to investors for applying these findings:
- Do not value companies on the basis of earnings or cash flow measures that exclude the cost of stock-based compensation.
- Consider screening out companies with very high levels of stock-based compensation, for example greater than 7-13% of operating expenses, especially if they have a market cap of less than $13.6 billion.
- Consider screening in companies with little or no stock-based compensation, for example less than 0.35% of operating expenses, as their incentive structures may better serve investors.
– Authored by Christopher Hyland, Master of Arts in Economics, The University of Texas at Austin, 2022. Nixon Capital Intern, Fall 2022.
Appendix – Additional Charts
CHART 11 – SBC/OpEx 90th Percentile Threshold, Russell 3000 Constituents
Source: S&P Global. For illustrative purposes only.
CHART 12 – Aggregate SBC, $ Billions, Russell 3000 Constituents
Source: S&P Global. For illustrative purposes only.
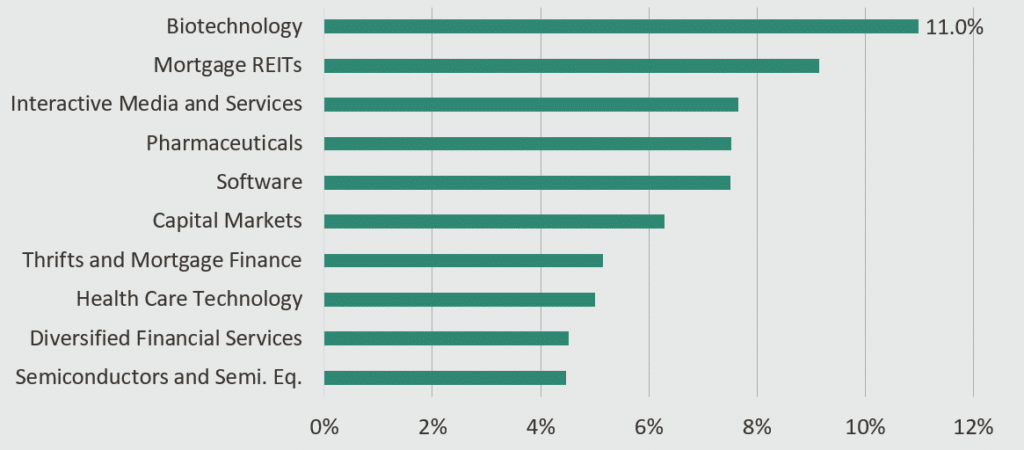
CHART 13 – SPB/OpEx, Top 10 Industries, 2010-2021, Russell 3000 Constituents
Source: S&P Global. For illustrative purposes only.
CHART 14 – Average Industry-Relative Return, by SBC/OpEx Decile, Russell 3000 Constituents
Source: S&P Global. For illustrative purposes only. Past performance does not guarantee future results.
References
- Bhojraj, Sanjeev. “Stock compensation expense, cash flows, and inflated valuations.” Review of Accounting Studies 25 (2020): 1078–1097. < https://link.springer.com/article/10.1007/s11142-020-09549-6>
- “Financial reporting developments. A comprehensive guide: Share-based payment” Ernst & Young, LLP (2022). < https://assets.ey.com/content/dam/ey-sites/ey-com/en_us/topics/assurance/accountinglink/ey-frd06440-191us-09-22-2022_v2.pdf?download>
- Meulbroek, Lisa K. “The efficiency of equity-linked compensation: Understanding the full cost of awarding executive stock options.” Financial management (2001): 5-44.< https://www.jstor.org/stable/3666404>
- Oyer, Paul. “Why do firms use incentives that have no incentive effects?” The Journal of Finance 59.4 (2004): 1619-1650. <https://citeseerx.ist.psu.edu/document?repid=rep1&type=pdf&doi=cb6a6e06f56807d3cc5baeee0f4a0f072446ddf8>
- Bebchuk, Lucian A. and Fried, Jesse M. Pay Without Performance: The Unfulfilled Promise of Executive Compensation. Harvard University Press, 2004. <http://www.law.harvard.edu/programs/olin_center/papers/pdf/Bebchuk_et%20al_528.pdf>
- Mohanram, Partha, Brian White, and Wuyang Zhao. “Stock-based compensation, financial analysts, and equity overvaluation.” Review of Accounting Studies 25.3 (2020): 1040-1077. <https://link.springer.com/article/10.1007/s11142-020-09541-0>
- Buffett, Warren E. “1986 Letter to Shareholders.” Berkshire Hathaway, Inc (1987). <https://www.berkshirehathaway.com/letters/1986.html>
- Damodaran, Aswath, Employee Stock Options (Esops) and Restricted Stock: Valuation Effects and Consequences (September 30, 2005). Available at SSRN: https://ssrn.com/abstract=841504
Any views expressed are subject to change at any time, and Nixon Capital disclaims any responsibility to update such views. All information is provided for informational purposes only. This information is not an advertisement and does not constitute an offer of any securities or investment advisory services. Information contained herein has been obtained from sources believed reliable but is not necessarily complete. Accuracy is not guaranteed. Nixon Capital has not reviewed any of the websites that may be linked to this letter and is not responsible for their content. Nixon Capital is not responsible for the privacy practices of such other websites. References to specific securities mentioned in this letter are not to be construed as investment recommendations and should not be relied upon as the basis for anyone to buy, sell or hold any security. Past performance is no guarantee of future results. All charts and graphs are provided for illustrative purposes only. This information is not to be reproduced or redistributed to any other person without the prior consent of Nixon Capital LLC.